Our new debugging manager
A new introduction in this version of our framework is our new dev debugger. It’s intended to help us see that everything is flowing correctly in the application, and it has dedicated panels for each of the areas that can interest us.
All of the messages that appear in the panels have been programmed into the core files of the framework, so you shouldn’t need to add any new ones.
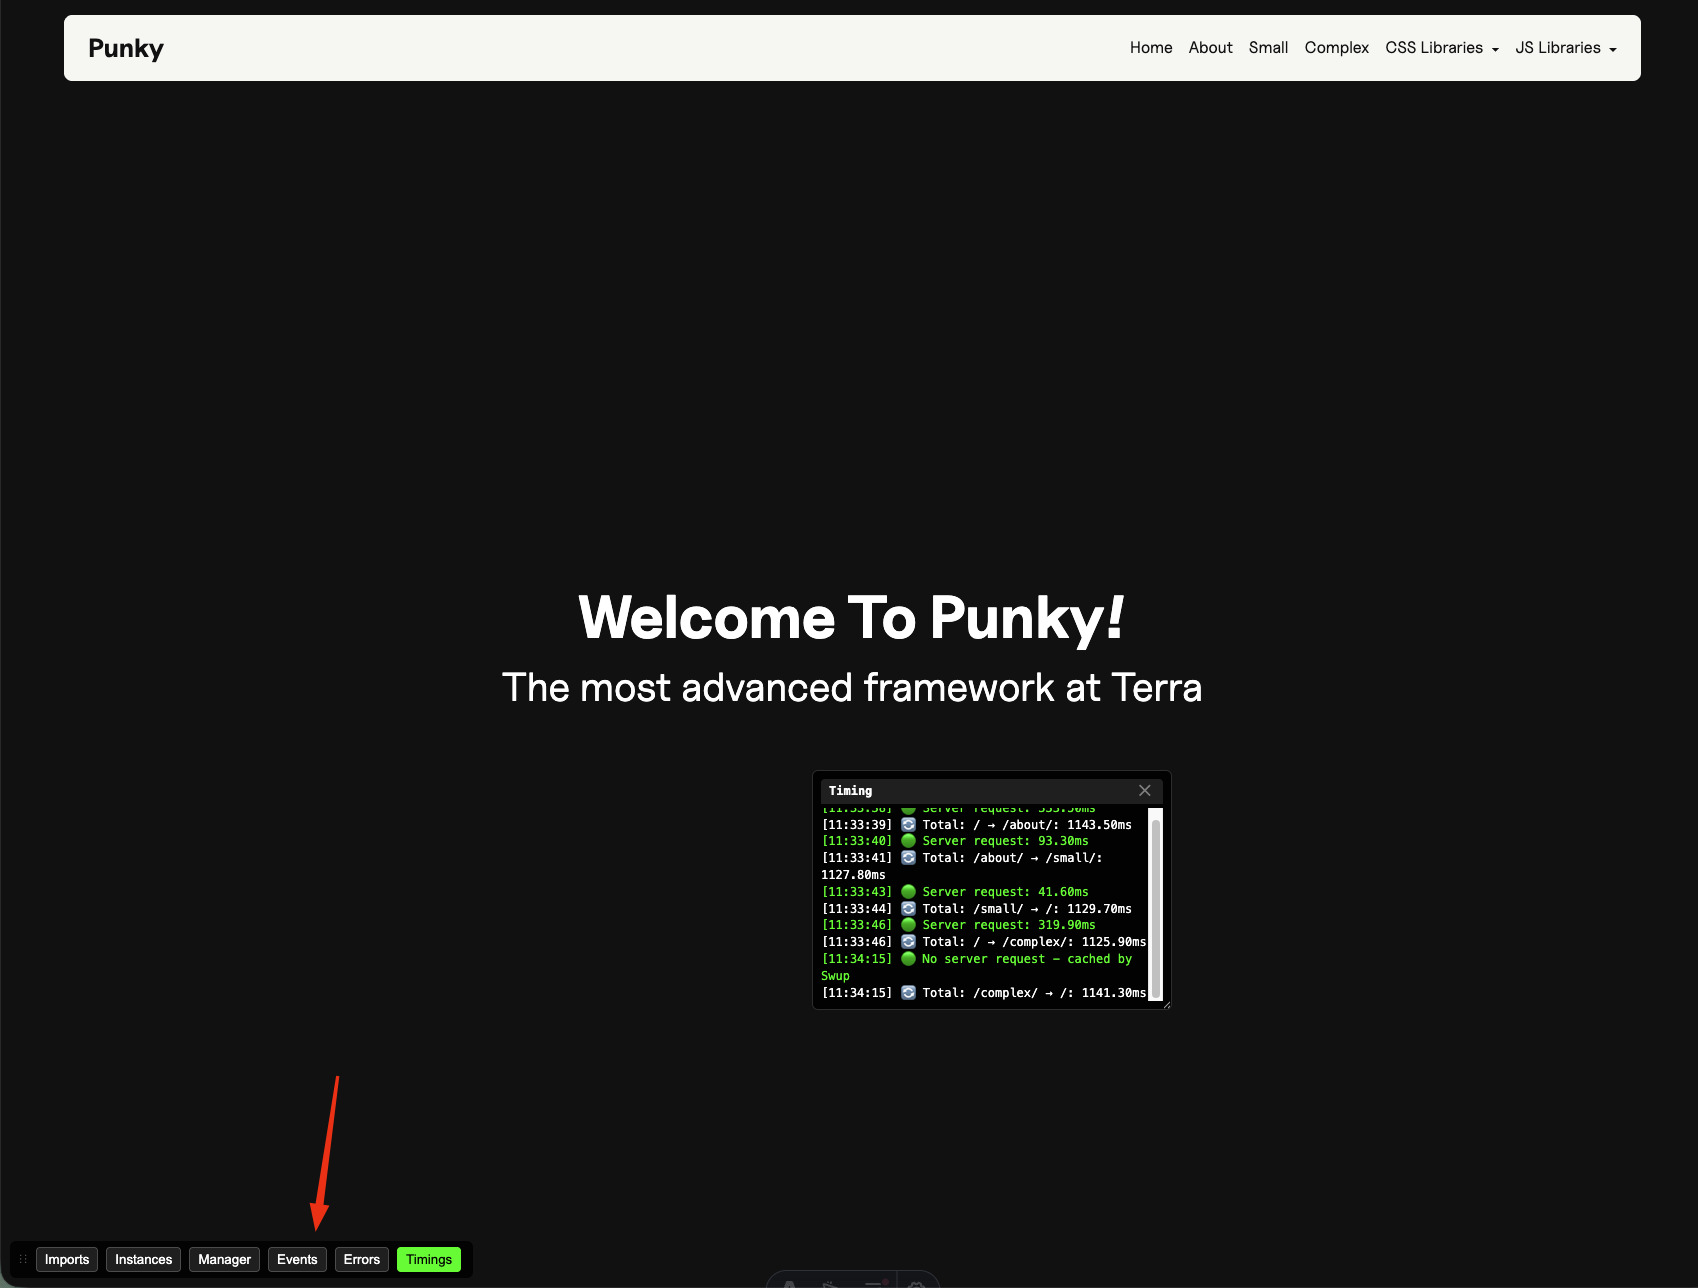
In dev mode, you will always see these new buttons at the bottom left of your screen. Each of them activates a new panel.
Imports
Section titled “Imports”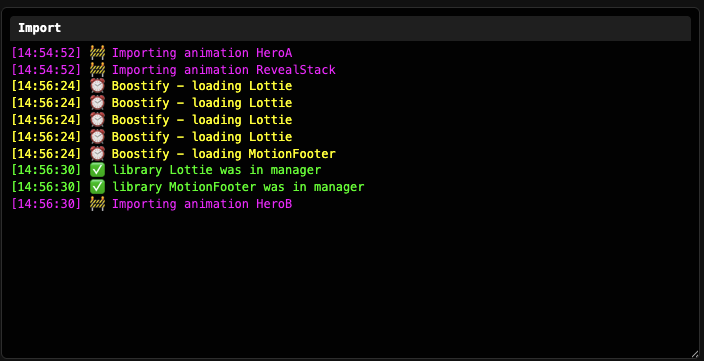
This first one will indicate us all the imports that are being made in the site and some more information about each of them:
- Messages in pink are animations
- Messages in yellow indicate regular imports - they are marked with a clock ⏰ when the import is made by Boostify
- Messages in green indicate that the library we required was already in the Manager
Instances
Section titled “Instances”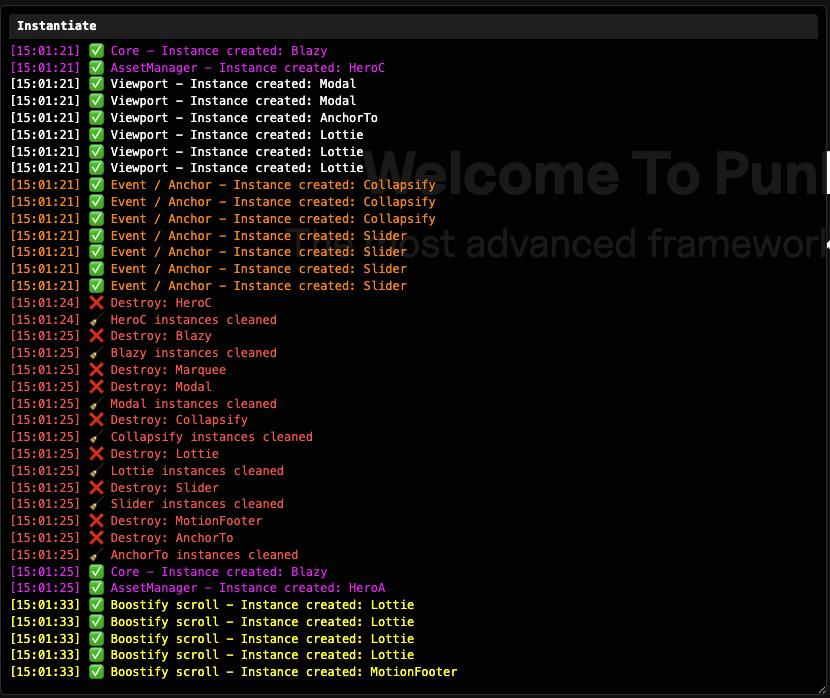
This panel will guide you through the instances that are being created while you navigate / work in the site.
- Messages in white indicate that the instance was created because the item was in the viewport from the start
- Messages in pink are animations and other libraries instanced from outside our CoreHandler and will tell you where that was instanced from - example: Core instances Blazy
- Messages in yellow are instances created via Boostify
- Messages in orange are instances created through a custom event, like a library in library or an Anchor
- Messages in red are all the destroys and cleanups of our instances
You can check here if your libraries are instancing when they should and who is instancing them, and you should see as many destroy messages as instance ones.
Manager
Section titled “Manager”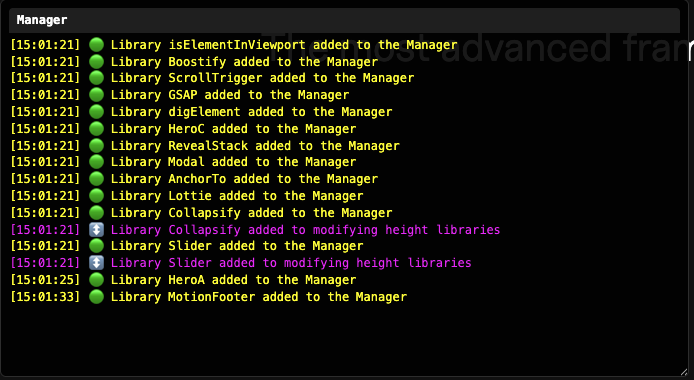
This one talks to us about everything that is going on internally in our Manager.
It will output one message per each library that is added to the Manager and it will also tell us with pink messages which ones of those are added to the height modifying libraries array.
Events
Section titled “Events”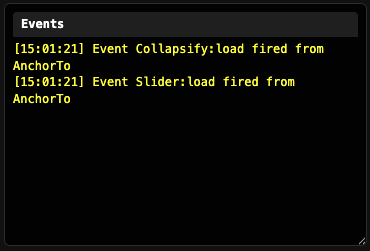
This panel contains all information of each event that is custom fired by our eventSystem, the name of the event and who fired it.
Errors
Section titled “Errors”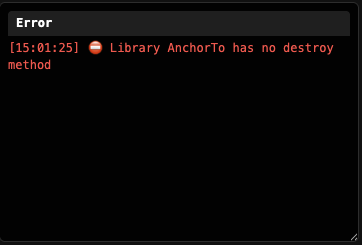
This one will contain all of our errors in imports / instances and also will pop up automatically when an error occurs. It will let us know if our CoreHandler attempted to destroy any of our classes and did not find a destroy method for it.
All errors will appear duplicated in their corresponding panel and in this error panel, so you have context at all times of what and where is failing.
Timings
Section titled “Timings”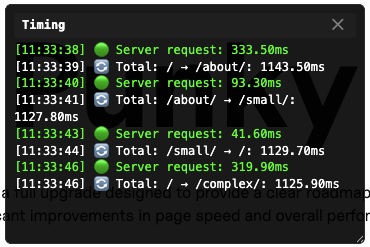
And this last panel contains information about the time we spend to go from one page to the next one.
This is divided into two categories:
- First, the server timings, that will be color coded to detect quickly when a request is taking longer than it should, the thresholds are:
- Green - all OK - up to 500ms
- Yellow - bit slow, but OK - 500 - 1000ms
- Orange - slow - 1000 - 2000ms
- Red - very slow, worrying - over 2000ms
- After that, we will always see a white message that indicates the total time the user experienced from the click to change the page to the time the next page fully loaded and the transition disappeared. This one we can reduce by making shorter transitions, if needed.
Knowledge Check
Test your understanding of this section
Loading questions...